Microsoft Orleans-Dashboard Update-CPU/Memory Stats
Quick update to a post I did a while back regarding Orleans Dashboard — additional reporting metrics for your cluster!
Microsoft Orleans — Dashboard Update — CPU/Memory Stats
As a refresher, Orleans is a virtual actor model framework — a framework that can be used to build new, distributed “primitives”. These primitives’ work can be farmed out to a cluster of nodes as a means of getting “work” done faster than what would be possible if working constrained to a single piece of hardware.
In a previous post:
How to set up Microsoft Orleans’ Reporting Dashboard
I had pointed out:
Currently CPU/Memory usage is not visible from the .net core implementation of Orleans. Hopefully something will be done to remedy that in the future? Perhaps it’s a limitation of the API available in netstandard?
This seems to have been true at a point in time, but it is no longer! (At least if you’re running in a windows runtime.)
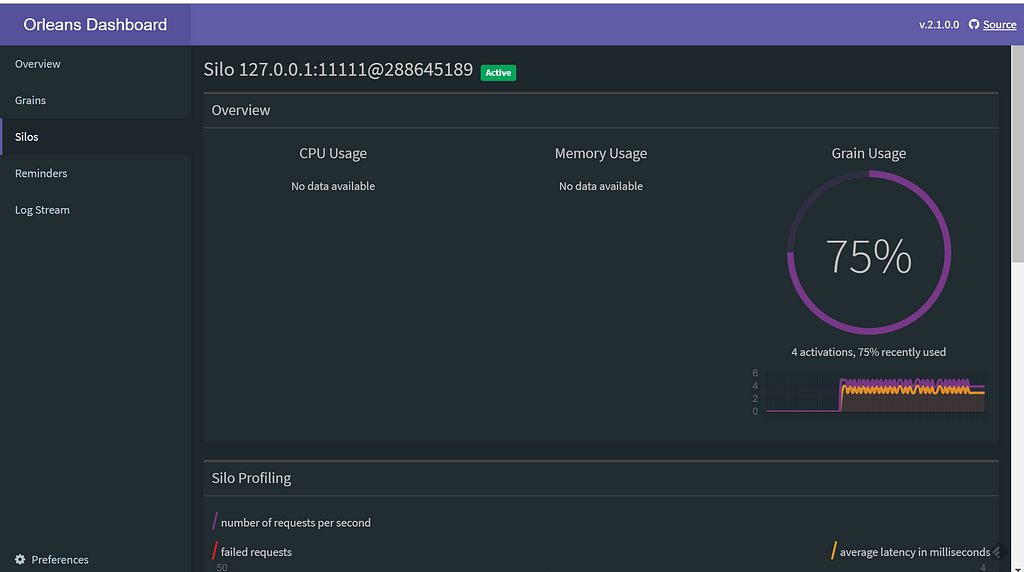
The additional CPU and memory metrics are completely dependant on a registered IHostEnvironmentStatistics implementation. By default, a “NoImplementation” implementation is registered, and you would see something like this in your Orleans log:
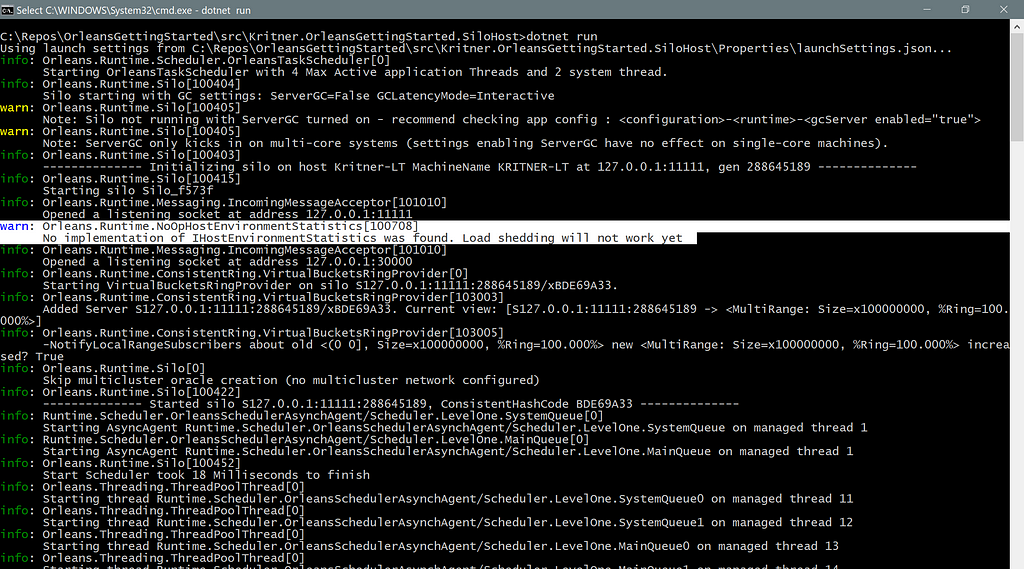
And this on your dashboard:
The whole reason I stumbled across getting these CPU/Memory metrics working on the dashboard, was I was pursuing getting the feature LoadShedding to work — which was apparently dependant on these metrics.
Through some back and forth on the Orleans Gitter I found out about the needed registered implementation of an IHostEnvironmentStatistics class. One of these classes does exist in the Orleans code, though it’s in a separate package, and an internal only class to that package:
Luckily, there is a SiloHost extension method that registers this implementation of IHostEnvironmentStatistics for use — albeit from a Windows only runtime environment (at least at the time of writing).
To get the CPU/Memory metrics work on our dashboard (and putting us in a position to work in LoadShedding) we need to do a few things:
- Install a new NuGet package
- Register an implementation of IHostEnvironmentStatistics — like the one provided in the NuGet package itself.
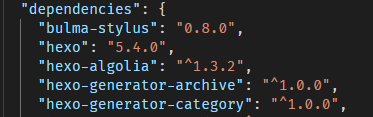
Install the NuGet Package
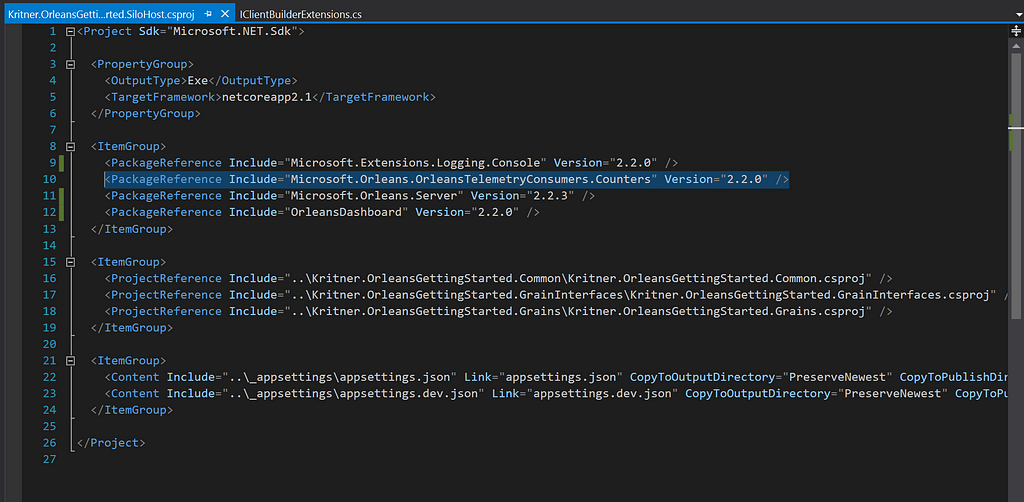
The IHostEnvironmentStatistics implementation exists within the Microsoft.Orleans.OrleansTelemetryConsumers.Counters package, install it via the GUI, CLI, etc. The csproj file from the SiloHost project should look something like this when done:
Registering the implementation of IHostEnvironmentStatistics
As previously mentioned, the new NuGet package has a Windows specific implementation of IHostEnvironmentStatistics contained within it, although it is an internal class. There is however, an extension method that can be used to register that internal class.
Let’s update our SiloHostBuilder:
Original
1 | |
And we just need to add .UsePerfCounterEnvironmentStatistics().
Updated
1 | |
That’s all there is to it! Now, we should get our CPU/Memory utilization reported on the Orleans Dashboard, and be in a better position to work in LoadShedding — perhaps for the next post!
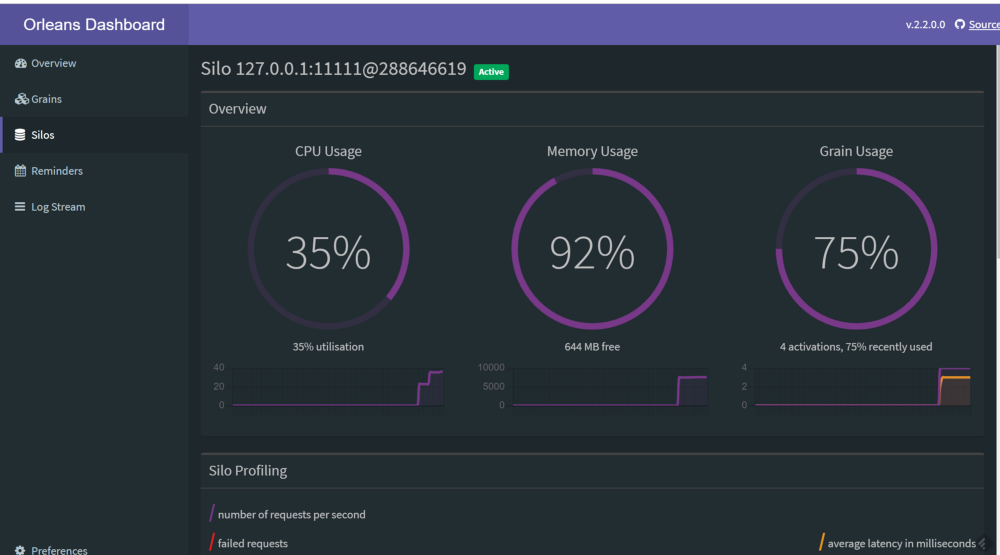
Now, looking at our dashboard, we can see:
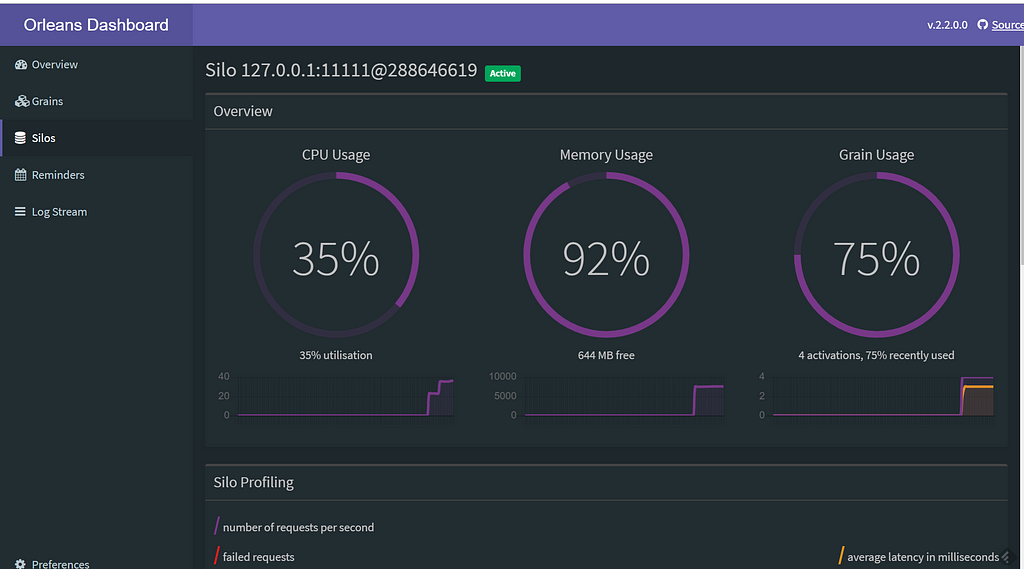
Now, we have even more insight into how our cluster is operating, and additional features such as LoadShedding are made available to us!
Related:
- Code as of post — https://github.com/Kritner-Blogs/OrleansGettingStarted/releases/tag/v0.57
- Info on enabling CPU/Memory metrics. by Kritner · Pull Request #212 · OrleansContrib/OrleansDashboard
- Getting Started with Microsoft Orleans
- Microsoft Orleans — Reusing Grains and Grain State
- Using polymorphism to update Orleans Project to be ready for new Orleans Examples!
- Microsoft Orleans — Reporting Dashboard
- Microsoft Orleans — Code Generation Issue
- Microsoft Orleans — Dependency Injection
- Microsoft Orleans — Reminders and Grains Calling Grains
- Microsoft Orleans — Easily switching between “development” and “production” configurations.
- Microsoft Orleans — Observables
Microsoft Orleans-Dashboard Update-CPU/Memory Stats
https://blog.kritner.com/2019/02/25/Microsoft-Orleans-Dashboard-Update-CPU-Memory-Stats/