Angular Basics - Pipes

Angular Basics - Pipes

Last post we worked on data binding, this post I want to expand on that. Right now we have no formatting, so I’d like to add currency formatting, and/or thousands separatorsto the bound data.

I recently started playing around with Angular for my solar projection page http://www.kritner.com/solar-projection/ and thought I’d document some of my experiences playing around with “new” tech — at least relatively speaking.

In my day job, I am a c# developer, currently solely a c# developer. Prior to this job, I was proficient in c#, db, and “okay” in some front end stuff.

To apply such formatting we can use pipes — https://angular.io/guide/pipes. Luckily, they’re simple to use, and there are a few that already exist that would work for my use case!

From https://angular.io/api I found the CurrencyPipe and the NumberPipe, both of which I will utilize on my model from the last post.

As a starting point:

1
2
3
4
5
6
7
8
9
10
11
12
13
14
15
16
17
18
19
20
21
22
23
24
25
26
27
28
29
30
31
32
33
34
35
36
37
38
39
40
41
42
43
44
45
46
<h1>Solar Projection</h1>

<p *ngIf="!solarProjection"><em>Loading...</em></p>

<div *ngIf="solarProjection">

<h4>Solar Estimate (Guaranteed for 90% of 17k Kw/year Production</h4>

<ul>
<li>Total Cost/year: {{ solarProjection.solarEstimate.totalCost }}</li>
<li>Total Kw/h/year: {{ solarProjection.solarEstimate.totalKiloWattHours }}</li>
<li>Avg Cost/month: {{ solarProjection.solarEstimate.averageCostPerMonth }}</li>
<li>Avg Cost/kw/h {{ solarProjection.solarEstimate.averageCostKiloWattHour }}</li>
<li>Total Years Financed: {{ solarProjection.financeYears }} </li>
</ul>

<table class='table'>
<thead>
<tr>
<th>Year</th>
<th>Total Cost Utility</th>
<th>Avg. Cost/month (Utility)</th>
<th>Cost/year 100% gen.</th>
<th>Savings/year 100% gen.</th>
<th>Cost/year 90% gen.</th>
<th>Savings/year 90% gen.</th>
<th>Cost/year 80% gen.</th>
<th>Savings/year 80% gen.</th>
</tr>
</thead>
<tbody>
<tr *ngFor="let projection of solarProjection.futureProjection">
<td>{{ projection.purchaseYear }}</td>
<td>{{ projection.totalCost }}</td>
<td>{{ projection.averageCostPerMonth }}</td>
<td>{{ projection.costSolar100Percent }}</td>
<td>{{ projection.totalSavings100Percent }}</td>
<td>{{ projection.costSolar90Percent }}</td>
<td>{{ projection.totalSavings90Percent }}</td>
<td>{{ projection.costSolar80Percent }}</td>
<td>{{ projection.totalSavings80Percent }}</td>
</tr>
</tbody>
</table>

</div>

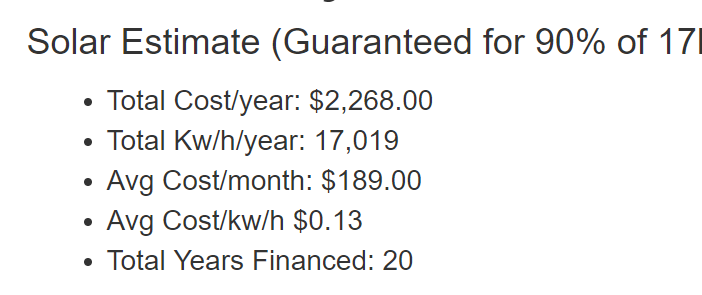
A large portion of these numbers (like “cost”s) can be considered “currency”, while the others are generally units of kw/h, which can be considered “number”. To apply pipes, you simply “pipe” your bound data into the “pipe” you’re using (similar to how you would do in bash) {{ myData | currency }} as an example.

Applying the above to our page, it now looks like:

1
2
3
4
5
6
7
8
9
10
11
12
13
14
15
16
17
18
19
20
21
22
23
24
25
26
27
28
29
30
31
32
33
34
35
36
37
38
39
40
41
42
43
44
45
46
<h1>Solar Projection</h1>

<p *ngIf="!solarProjection"><em>Loading...</em></p>

<div *ngIf="solarProjection">

<h4>Solar Estimate (Guaranteed for 90% of 17k Kw/year Production</h4>

<ul>
<li>Total Cost/year: {{ solarProjection.solarEstimate.totalCost | currency }}</li>
<li>Total Kw/h/year: {{ solarProjection.solarEstimate.totalKiloWattHours | number }}</li>
<li>Avg Cost/month: {{ solarProjection.solarEstimate.averageCostPerMonth | currency }}</li>
<li>Avg Cost/kw/h {{ solarProjection.solarEstimate.averageCostKiloWattHour | currency }}</li>
<li>Total Years Financed: {{ solarProjection.financeYears }} </li>
</ul>

<table class='table'>
<thead>
<tr>
<th>Year</th>
<th>Total Cost Utility</th>
<th>Avg. Cost/month (Utility)</th>
<th>Cost/year 100% gen.</th>
<th>Savings/year 100% gen.</th>
<th>Cost/year 90% gen.</th>
<th>Savings/year 90% gen.</th>
<th>Cost/year 80% gen.</th>
<th>Savings/year 80% gen.</th>
</tr>
</thead>
<tbody>
<tr *ngFor="let projection of solarProjection.futureProjection">
<td>{{ projection.purchaseYear }}</td>
<td>{{ projection.totalCost | currency }}</td>
<td>{{ projection.averageCostPerMonth | currency }}</td>
<td>{{ projection.costSolar100Percent | currency }}</td>
<td>{{ projection.totalSavings100Percent | currency }}</td>
<td>{{ projection.costSolar90Percent | currency }}</td>
<td>{{ projection.totalSavings90Percent | currency }}</td>
<td>{{ projection.costSolar80Percent | currency }}</td>
<td>{{ projection.totalSavings80Percent | currency }}</td>
</tr>
</tbody>
</table>

</div>

Which will look like:

Pipe applied data

Related:

Author

Russ Hammett

Posted on

2018-09-04

Updated on

2022-10-13

Licensed under

Comments